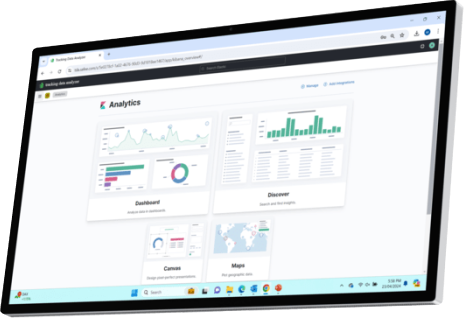
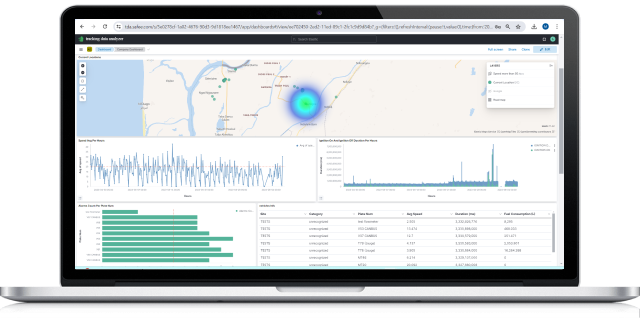
An integration with Elasticsearch and Kibana to provide profound analysis of real time tracking data. It orchestrates data combinations and visualizations, gives a comprehensive view of all their fleet dynamics, and supports fleet managers decisions.

image

Advanced
Dashboards and Data

Visualizations

Build comprehensive dashboards in minutes, combine charts, maps, impressive data visualizations, and complex filters to show the whole story of your business data. Create customized dashboard-to-dashboard drilldowns that enable insightful analysis.

image

Dynamic Reporting

Pioneering tools that enrich the processes of generating, scheduling, and displaying the reports of vehicle tracking services. You can filter and aggregate data in real-time based on customizable report models and modern data analysis methodologies.

Key Benefits

  • fleet managers
    Enhanced Decision-Making
  • fleet tracking
    Comprehensive Fleet Insights
  • real time monitoring
    Real-time Monitoring
  • fleet efficiency
    Improved Efficiency
  • custom tracking
    Customizable Reporting
fleet management

Enhanced Decision-Making

TDA provides fleet managers with profound analysis of real-time tracking data, enabling informed and strategic decision-making to optimize fleet operations.

fleet management & tracking

Comprehensive Fleet Insights

With advanced dashboards and data visualizations, TDA offers a comprehensive view of fleet dynamics, allowing managers to identify trends, patterns, and areas for improvement.

real time fleet monitoring

Real-time Monitoring

TDA facilitates real-time monitoring of fleet activities, helping managers stay updated on vehicle locations, statuses, and performance metrics.

fleet efficiency

Improved Efficiency

By orchestrating data combinations and visualizations, TDA streamlines data analysis processes, saving time and resources while improving operational efficiency.

vehicle tracking data

Customizable Reporting

The dynamic reporting feature allows for the creation of customized reports based on specific business requirements, enabling managers to track key performance indicators and monitor progress effectively.

Frequently Asked Questions

Raw tracking data in a spreadsheet export requires someone to interpret it – which means it usually doesn’t get looked at consistently, and when it does, decisions are made from stale information. FMSi’s Tracking Data Analysis solution – built on an integration with Elasticsearch and Kibana – transforms that raw data into live, visual dashboards that fleet managers can read at a glance without any data manipulation. Charts, maps, filters, and visualizations are combined in one view and update in real time, so the information being acted on reflects what’s actually happening now, not what happened three days ago when the last report was pulled.

This is precisely what the dashboard and reporting architecture is designed to handle. FMSi’s TDA platform allows multiple customized dashboards to be built and saved for different audiences and purposes – each pulling from the same underlying data but presenting it in the format most relevant to that team. Dashboard-to-dashboard drilldowns mean a senior stakeholder can start from a high-level summary and click through to the granular operational detail when needed, without requiring a separate report to be prepared. Reports can also be scheduled to generate and distribute automatically, so each team receives their relevant view without operations staff manually producing them.

Yes – and this is a core design principle of the platform rather than an add-on feature. FMSi’s dynamic reporting tools allow fleet managers to define their own report models based on the specific metrics, aggregations, and filters that reflect their business requirements. Rather than working within the constraints of a fixed report template, the system supports customizable report structures that can be saved, scheduled, and iterated over time as reporting needs evolve. This means the platform adapts to how your operation measures performance – not the other way around.

FMSi’s advanced dashboards are specifically designed for fleet-wide pattern recognition rather than vehicle-by-vehicle review. Data combinations and visualizations can be configured to surface trends across regions, vehicle types, time periods, or operational categories simultaneously – giving fleet managers a comprehensive view of dynamics across the entire operation in a single dashboard. This is where the Elasticsearch and Kibana integration delivers its clearest advantage: the ability to query and visualize large volumes of tracking data across a wide fleet without performance degradation, making fleet-wide analysis genuinely practical rather than technically impractical.

FMSi’s Tracking Data Analysis is an integrated component of the FMSiTrack platform, not a standalone tool requiring separate access or data imports. The tracking data generated by vehicles – positions, events, driver behaviour, journey records – feeds directly into the TDA layer without any manual data transfer. This means dashboards and reports reflect the live state of the fleet automatically, and fleet managers work from one platform rather than reconciling data between separate systems. The analysis capability sits on top of the same data that powers real-time monitoring, route planning, and all other FMSiTrack modules.